From percentage factors to additive deltas—theory, evidence, and a ready-to-use formula and table
In the official game reference, park effects are published as multiplicative factors (100 = neutral). For example, Baker Bowl (1915–1919) shows an LHB HR factor of 227—interpreted as 127% of neutral, or 27% more home runs. That representation is intuitive but has a well-known drawback: the same physical park effect (e.g., a short porch) produces different percentage impacts for different player types. A 60 HR/600 slugger and a 10 HR/600 contact hitter both gain roughly the same number of home runs at Baker Bowl; the former shows a smaller percentage increase than the latter.
Our theoretical stance, following community research (Karim/BluePhnx and the Park Factor Data workbook), is that park effects are additive: each park adds or subtracts a fixed number of 1B, 2B, 3B, and HR per 600 at-bats, independent of the batter’s baseline rate. That model is consistent with the idea that the park changes the environment (fence distance, wall height, surface), not the batter’s skill. Under that theory, the correct way to state the effect is in additive deltas (e.g., +10.4 HR per 600 AB at Baker Bowl), not in multiplicative factors.
Official evidence base. Imagine Sports has stated that the additive (constant-difference) model is an evidence-based design choice. Tom Tippett presented on this at the 2004 SABR convention; his research compared whether parks affect HR rates on a percentage vs. constant basis and found evidence mostly supporting the latter, consistent with the DMB model. The 2004 SABR presentation handout is available under Imagine Sports Downloads. Our work here documents and quantifies that additive behavior from DMB exports and links it to the reference factors.
We hypothesized that:
We used two sources. (1) DMB park exports: per-park CSV files (Player, AB, H, 2B, 3B, HR) and a baseline file (All Parks or Neutral Park). Handedness was parsed from the Player column (L/R/S). (2) Official reference: the Imagine Sports Ballparks reference (dimensions and LHB/RHB factors for 1B, 2B, 3B, HR; 100 = neutral). The golden-ratio fit and reference table in this document use deltas derived with the All Parks baseline (the game’s standard comparison).
For each player with sufficient AB at both the park and the baseline, we computed the per-600 rate difference for each stat (1B = H − 2B − 3B − HR in each context). The park delta is the mean of those per-player diffs. We did this separately for LHB and RHB when handedness was available. Result: a table of additive deltas (1B, 2B, 3B, HR per 600 AB) per park and hand, with quality tiers (High/Medium/Low) by sample size.
In Karim’s Park Factor Data, the additive HR diff at Baker Bowl is roughly constant (~+10.5 per 600 AB) across high-power, medium-power, and low-power hitters. The multiplicative ratio varies wildly (e.g., 27% for sluggers vs 85% for low-power). Same park, same physical effect—only the additive description is stable. We therefore treat the additive model as the correct one for valuation and adjustment.
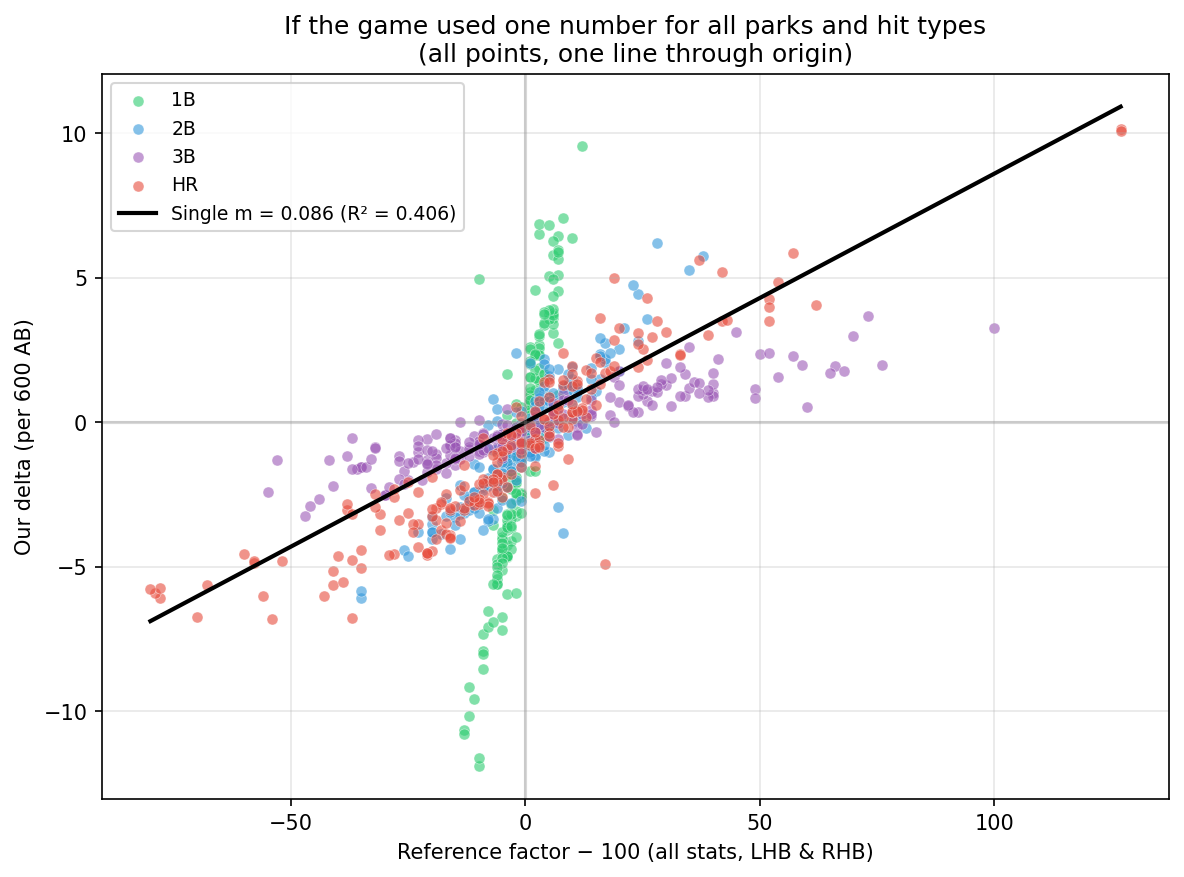
The naive conversion from a multiplicative factor to an additive change at a fixed baseline is implied_delta = baseline_per_600 × (factor/100 − 1). In practice the reference factors may come from aggregate ratios, so we asked: is there a single scaling constant m per (stat, hand) such that Δ = m × (factor − 100) fits our derived deltas? We also tested whether one static m for all parks and hit types could describe the data: we layered every matched point (all stats, LHB and RHB) on one chart and fitted a single line through the origin.
Single-number result: the best-fit universal m is ≈ 0.086 with R² = 0.41. So if the game used one constant for every park and hit type, that would be the implied value—but the fit is poor. When we fit m separately per (stat, hand), R² is about 0.72–0.84. We conclude the relationship is not one static number; it is linear per stat (and hand) with different m values. We therefore use the per-stat, per-hand m below.
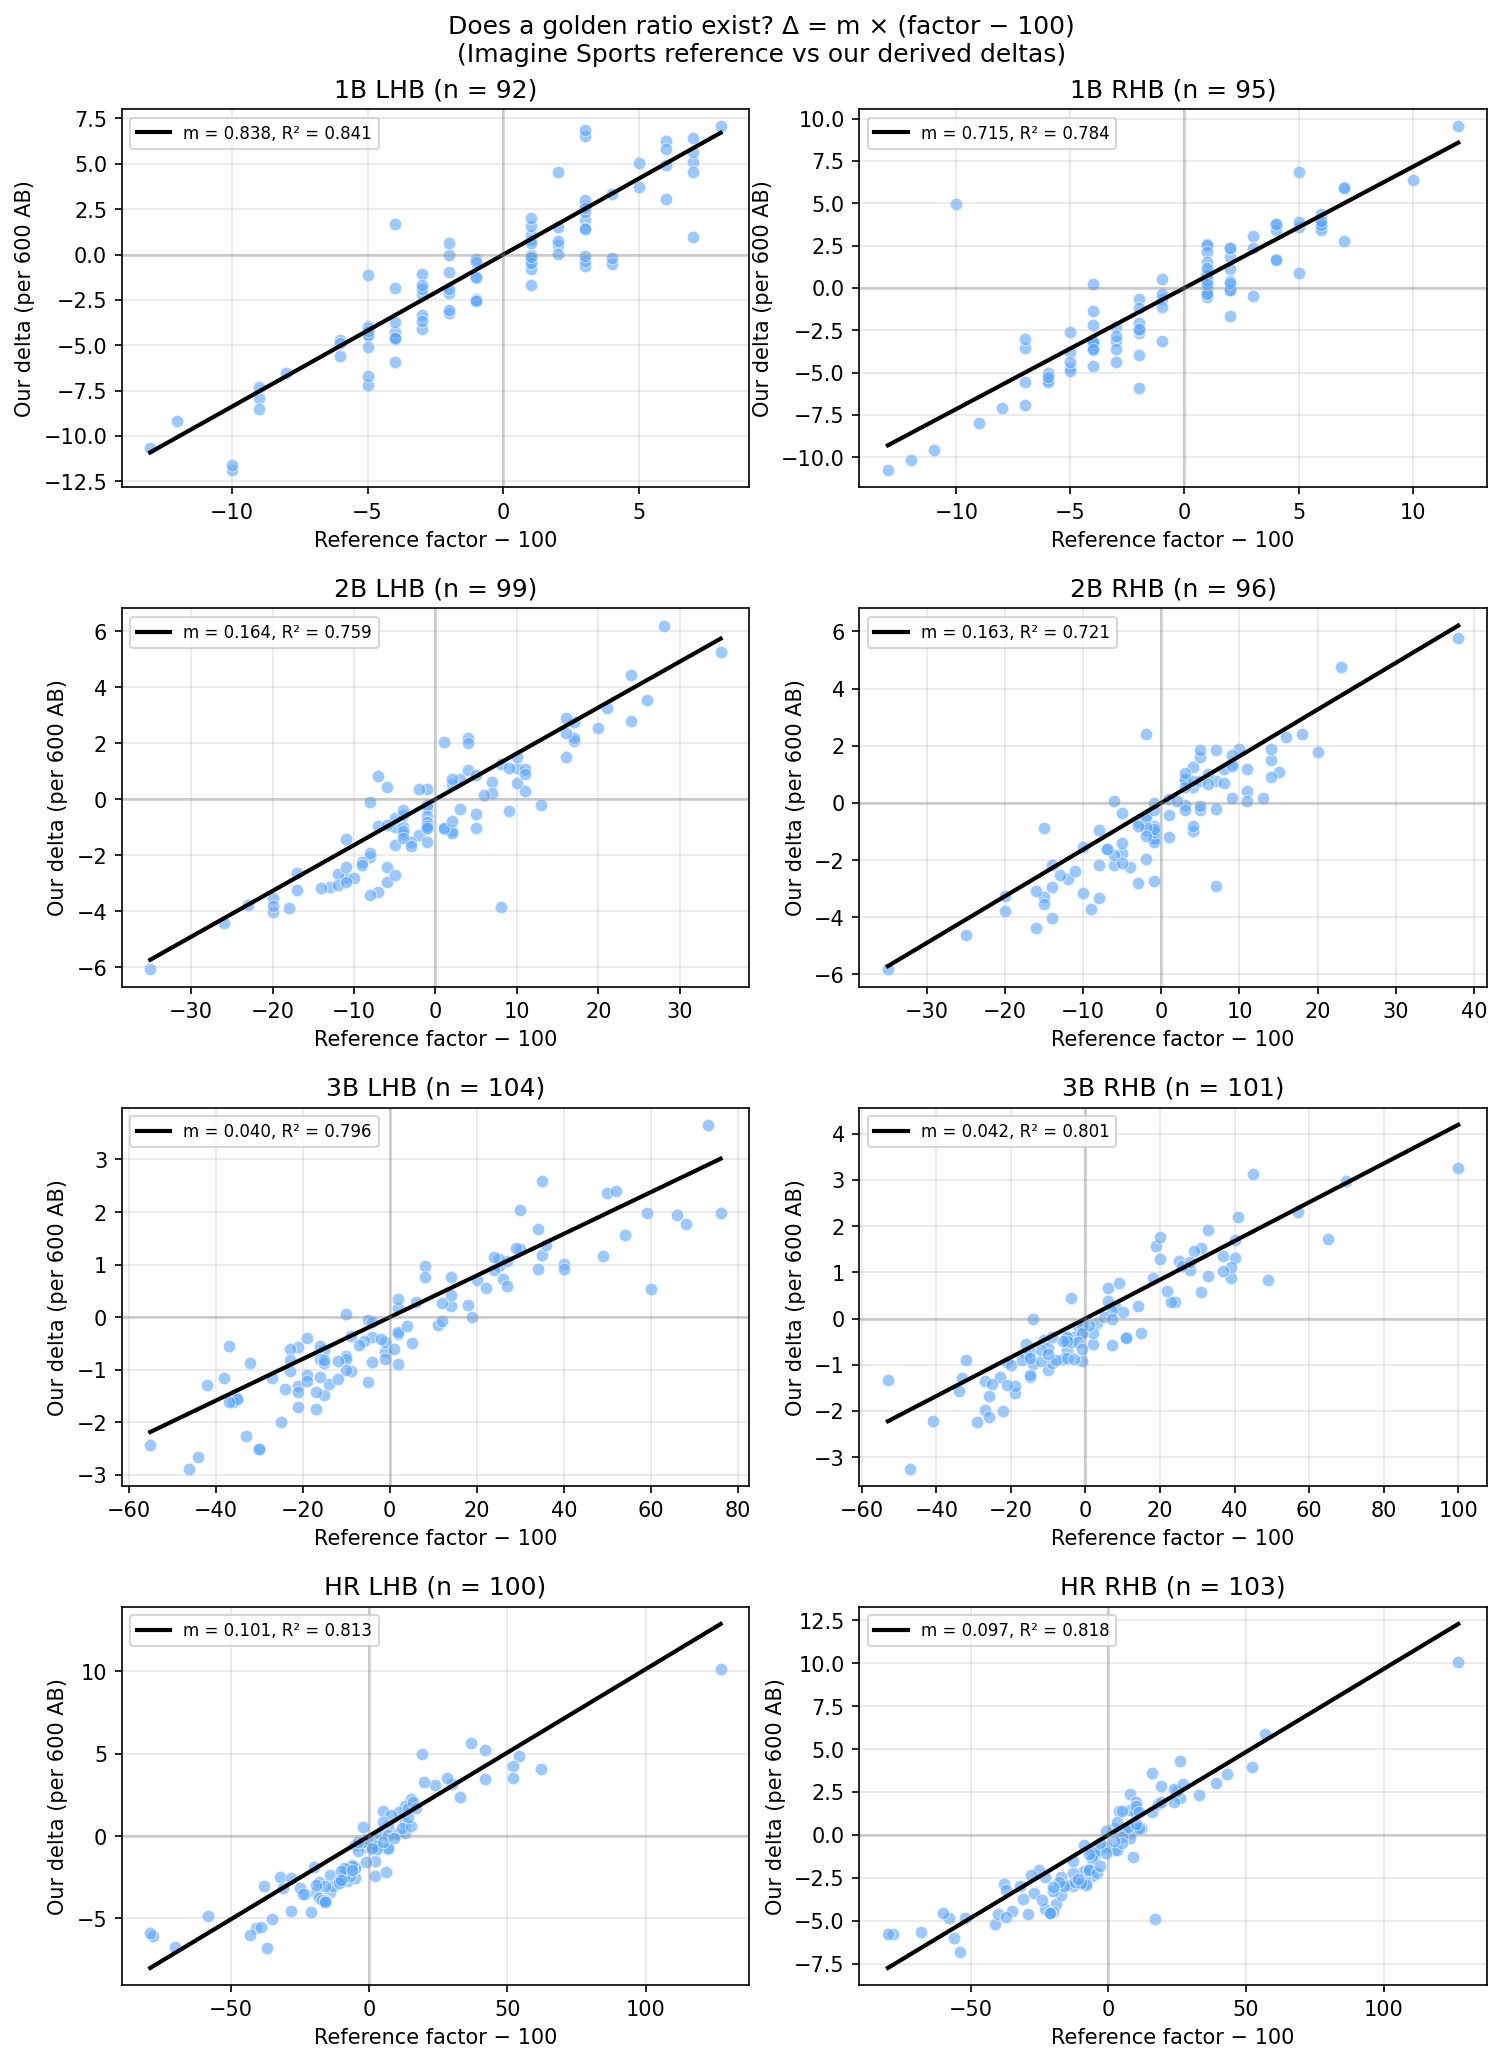
The per-stat, per-hand relationship is approximately linear (R² ≈ 0.72–0.84). Given variance and data limitations, we assume the golden ratio holds per stat and hand and settle on the fitted m below as the set of numbers we use when derived deltas are missing.
We present the following m values for translating the Imagine Sports reference (factor − 100) into additive deltas (per 600 AB). Formula: Δ = m × (factor − 100) — multiply the reference factor minus 100 by m to get the delta per 600 AB. We use them with moderate confidence: R² ≈ 0.72–0.84; we treat the remainder as variance and data limitations. For parks where we have DMB-derived deltas we prefer those; for parks only in the reference we use these m values.
How to read: For a given stat and hand, delta = m × (reference factor − 100). Example: LHB HR factor 127 → (127−100) × 0.102 ≈ +2.75 HR per 600 AB.
| Stat | Hand | m | R² | n |
|---|---|---|---|---|
| 1B | LHB | 0.839 | 0.84 | 92 |
| 1B | RHB | 0.715 | 0.78 | 95 |
| 2B | LHB | 0.164 | 0.76 | 99 |
| 2B | RHB | 0.163 | 0.72 | 96 |
| 3B | LHB | 0.040 | 0.80 | 104 |
| 3B | RHB | 0.042 | 0.80 | 101 |
| HR | LHB | 0.102 | 0.81 | 100 |
| HR | RHB | 0.097 | 0.82 | 103 |
| All | All | 0.086 | 0.41 | 790 |
Single source: data/golden_ratio_fit.csv. Fitted from Imagine Sports reference vs our deltas (through-origin). “All, All” = one m for all parks and hit types (poor R²).
Community feedback (e.g. willibphx) suggested that the game might use additive effects for extra-base hits (2B, 3B, HR) but multiplicative for 1B, given the higher propensity of singles and smaller range in 1B park factors. Under a multiplicative 1B model, each player’s delta would be delta_1B = 1B_per_600_neutral × (PF − 100)/100, so at park level the mean delta is still linear in (PF − 100), with slope = E[1B per 600 at neutral]/100. Our fitted additive m for 1B (0.72–0.84) would then match multiplicative if the mean 1B rate at neutral in our sample were 72–84 per 600 AB—within a plausible range.
We tested whether a multiplicative 1B formulation with league-average 1B = 100 per 600 (slope = 1) fits the data: we forced delta = (PF − 100) for 1B and computed R². For LHB, R² falls from 0.84 (additive fit) to 0.81; for RHB, from 0.78 to 0.66. So additive 1B (or multiplicative with a lower effective 1B rate) fits our park-level data better than multiplicative with c = 100.
Player-level test. To close the question, we tested additive vs multiplicative 1B at the player level. Under additive, each player at a given park has the same 1B delta, so the regression of delta_1B on 1B per 600 at baseline (within that park and hand) should have slope ≈ 0. Under multiplicative, delta_1B = 1B_per_600_baseline × (PF − 100)/100, so the slope should equal (PF − 100)/100. We ran this regression for every (park, hand) with at least 25 qualifying players (208 park–hand cells), using the same DMB exports and All Parks baseline. Results: mean observed slope = −0.007 (std 0.064); correlation(observed slope, (PF − 100)/100) = −0.03. The observed slopes are therefore near zero and uncorrelated with the multiplicative prediction. That is consistent with additive 1B and inconsistent with multiplicative 1B. We therefore retain additive for all four stats (1B, 2B, 3B, HR) in this document with no further work required on this question.
Park-level R²: data/hybrid_1b_r2.csv (scripts/plot_golden_ratio.py). Player-level slopes: data/player_level_1b_slopes.csv (scripts/player_level_1b_analysis.py).
We value the data we have more and treat sparse or noisy data as contributing variance rather than as evidence against the ratio. Under that assumption, we adopt the table above as the golden ratio and use it to build the combined reference table when derived deltas are missing.
We combine the official Imagine Sports reference (dimensions, layout) with our additive deltas. The table below keeps the game’s dimension columns and replaces the LHB/RHB factor columns (1B, 2B, 3B, HR as percentages) with our additive columns: LHB and RHB deltas in units of per 600 AB (1B, 2B, 3B, HR). The neutral park row is excluded. Where we have derived deltas we use them; otherwise we use the golden-ratio formula above. Each table number answers: “How many more (or fewer) of that stat per 600 AB does this park add for LHB or RHB?”
Table is generated by scripts/build_park_reference_with_additive.py. Dimensions and layout from Imagine Sports Ballparks; additive columns from our derived deltas or m × (factor − 100).
Full table (106 parks): Open full table | Download CSV. Preview (first 5 rows) below.
| Park | Years | City | Surface | Cover | LF Line | Left | LF Gap | Center | RF Gap | Right | RF Line | LHB 1B | LHB 2B | LHB 3B | LHB HR | RHB 1B | RHB 2B | RHB 3B | RHB HR |
|---|---|---|---|---|---|---|---|---|---|---|---|---|---|---|---|---|---|---|---|
| American Family Field | 2021-2025 | Milwaukee | Grass | Retractable | 342/8 | 365/8 | 385/8 | 400/8 | 385/8 | 370/8 | 356/8 | −6.52 | −0.98 | −0.15 | +2.22 | −3.65 | −1.60 | +0.28 | +2.39 |
| Anaheim Stadium | 1966-1970 | Anaheim | Grass | Outdoor | 333/5 | 370/10 | 382/10 | 392/10 | 367/10 | 368/10 | 333/5 | +1.02 | −2.81 | −1.47 | −2.57 | −4.38 | −4.38 | −0.87 | −2.38 |
| Angel Stadium | 2013-2017 | Anaheim | Grass | Outdoor | 330/5 | 368/5 | 392/8 | 408/8 | 368/18 | 358/18 | 330/5 | +1.29 | −3.33 | −1.42 | −2.34 | −2.57 | −1.56 | −1.68 | −2.78 |
| Astrodome | 1977-1981 | Houston | Artificial Turf | Dome | 340/10 | 375/10 | 400/10 | 406/10 | 400/10 | 375/10 | 340/10 | −3.25 | −2.95 | +0.73 | −5.62 | −2.67 | −3.71 | +0.35 | −6.79 |
| Baker Bowl | 1915-1919 | Philadelphia | Grass | Outdoor | 335/4 | 346/4 | 379/4 | 408/47 | 304/47 | 286/60 | 272/60 | −0.24 | +0.71 | +0.18 | +10.13 | −0.65 | +0.80 | −0.17 | +10.08 |
Park effects in our dataset are well described by additive deltas per 600 AB. The game’s multiplicative reference factors map to that scale by a per-stat, per-hand golden ratio m: Δ = m × (factor − 100), with R² ≈ 0.72–0.84. We tested a single universal m (poor fit) and a hybrid model (additive XBH, multiplicative 1B) at both park and player level; the data support additive for all four stats, including 1B. We adopt the fitted m per (stat, hand) and the combined reference table (game dimensions with additive LHB/RHB columns per 600 AB) as the main output. Use the table or the formula when derived deltas are missing.
Credits: Karim (BluePhnx) for the additive methodology; Imagine Sports for the official park reference. Tom Tippett’s 2004 SABR presentation (evidence for the additive model) is available under Imagine Sports Downloads. Downloads on this site: the full reference table (CSV) and golden-ratio fit stats (CSV) are linked in the TL;DR above. We are not publishing the underlying DMB export data or the analysis scripts here; those are project-internal sources used to produce the table and fits.